 An official website of the United States government.
  Official websites use .gov
A .gov website belongs to an official government organization in the United States.
Official websites use .gov
A .gov website belongs to an official government organization in the United States. Secure .gov websites use HTTPS
A lock or https:// means you’ve safely connected to the .gov website. Share sensitive information only on official, secure websites.
Secure .gov websites use HTTPS
A lock or https:// means you’ve safely connected to the .gov website. Share sensitive information only on official, secure websites.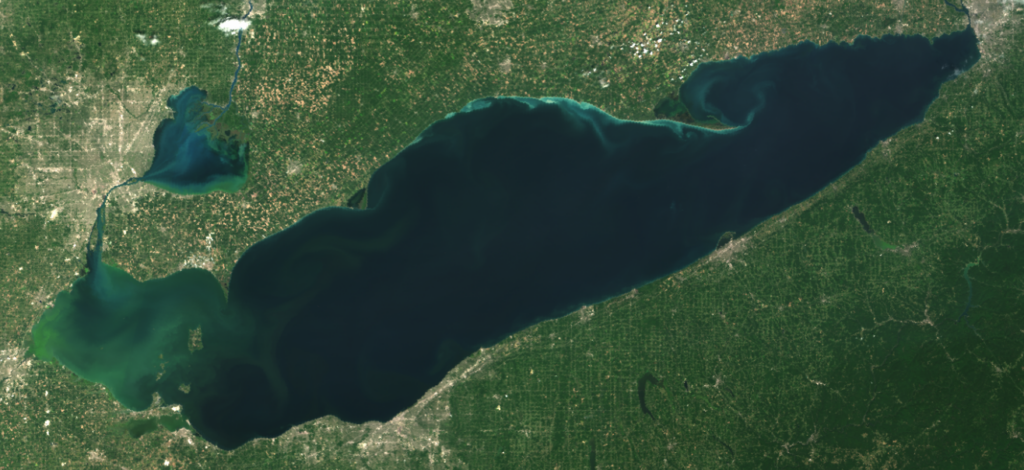
Truecolor image of the Microcystis cyanobacteria bloom in western Lake Erie on August 22, 2020, produced using data derived from Copernicus Sentinel-3 data provided by EUMETSAT.
October marked the end of the summer harmful algal bloom (HAB) season on Lake Erie. The 2020 Microcystis bloom had a final severity index (SI) of 3.0, much less than in 2019 when the severity was 7.3. The forecasted bloom severity was between 4 and 5, a small overestimate of the measured SI of 3.0.
An SI above 5 indicates a potentially harmful bloom. The index is based on the amount of bloom biomass over the peak 30 days of the bloom. The largest blooms, 2011 and 2015, were 10 and 10.5, respectively.
This forecast uses an ensemble of different models, which consider phosphorus loading into the lake during the spring and early summer. One of the models correctly forecast the severity, other models over-estimated the severity by different amounts. NOAA scientists will examine these differences in comparison with forecasts for previous years to evaluate the models.
The 2020 bloom developed starting in late July, and reached a peak during the last week of August. It weakened rapidly in the first week of September, following several days of strong wind events (20 mph or more), including 40 mph winds on September 7. The winds may have shorted the duration of the bloom. If the peak of the end of August had lasted into mid-September, the severity could have been as high as 3.4, as observed in 2018.
For the full final bulletin and seasonal assessment, click here.
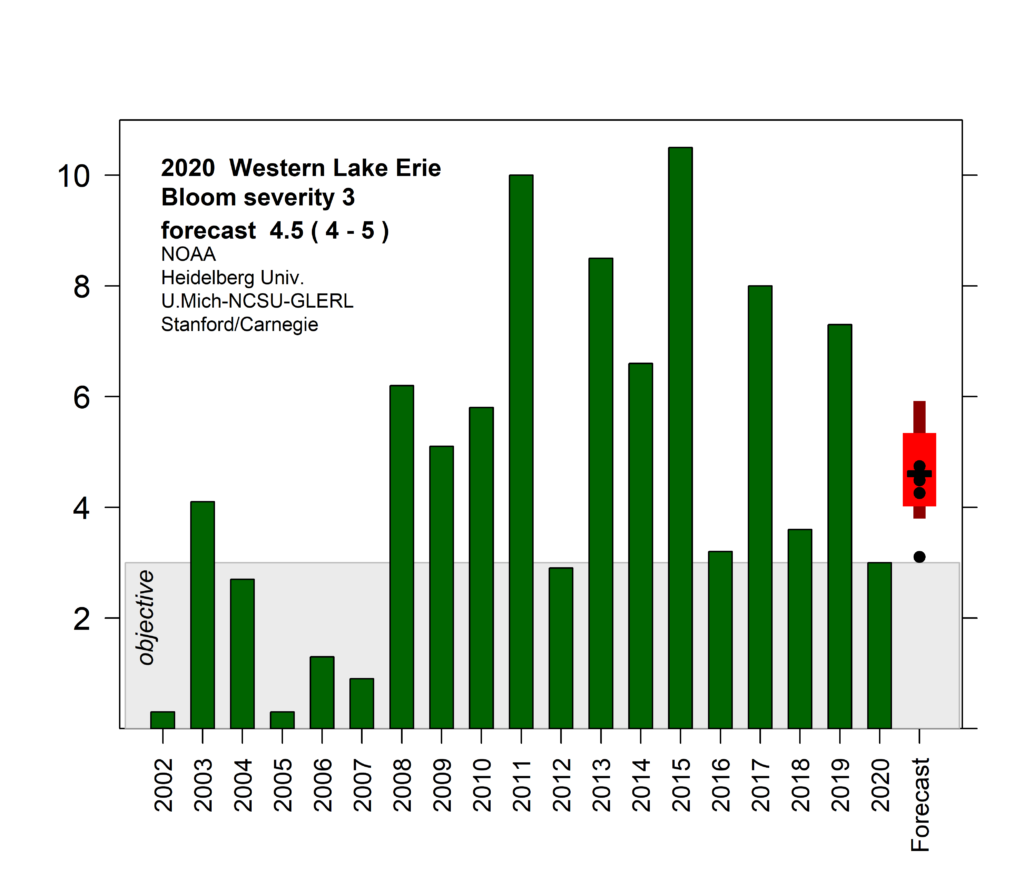
Figure 1. Bloom severity index for 2002-2020, and the forecast for 2020. The index is based on the amount of biomass over the peak 30-days. The 2020 bloom had a severity of 3, much smaller than 2019. 2011 had a severity of 10; 2015 was 10.5. The 2020 forecast ensemble range appears as red vertical bars, and the forecasts from individual models are shown as black filled circles.
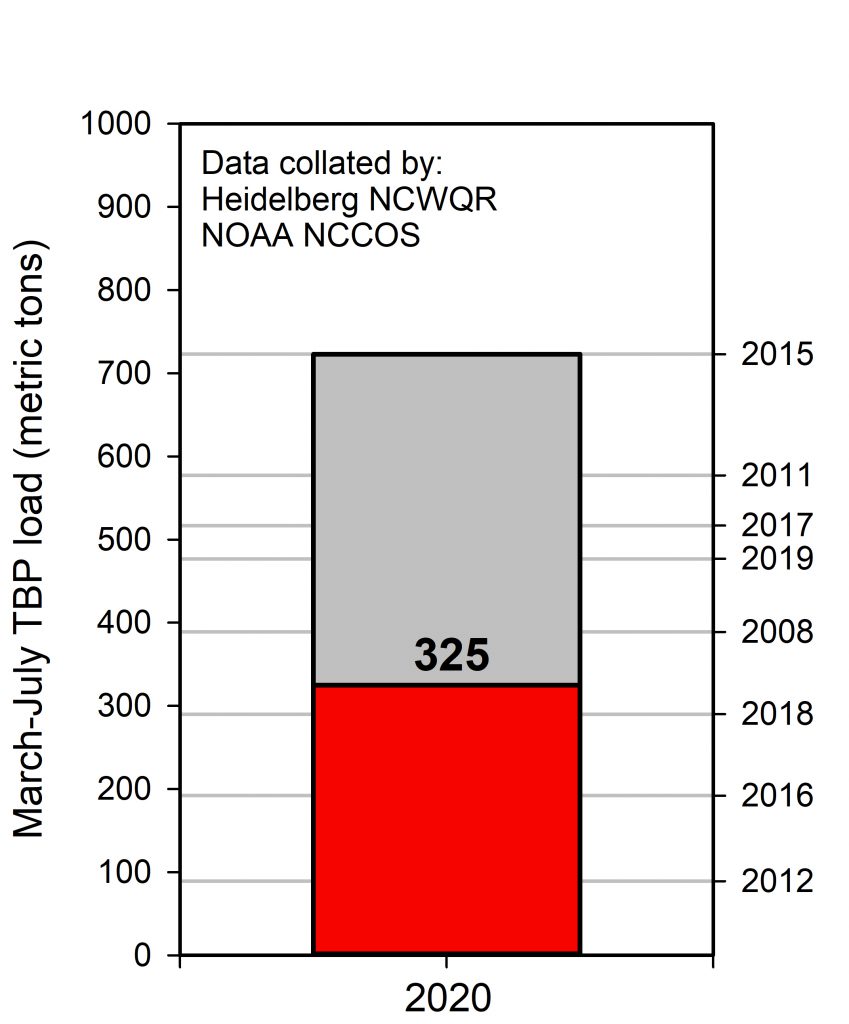
Figure 2. Total bioavailable phosphorus from the Maumee River for 2020 compared to some other years. Data collected by Heidelberg University.