A NOAA supported research team provides dynamic flood maps–an upgrade from simple flood maps–that better inform flood mitigation decisions. Their more visual approach captures an animated view of how flooding shifts coastlines and helps communicate flood risk on dynamic coasts.
This research team is a leader in advancing data collection methods, improving water level and wave model prediction, running coastline change models (morphodynamic models) and communicating the results. They work closely with an advisory group of coastal decision makers to gather input on select storm scenarios and the timing of desired outputs. The users offer key input to refine the visualization to better reflect local conditions and inform actions. Users also work with designers and weigh in on design elements, such as shadowing or colors in the three-dimensional image so as to avoid biased interpretation of the output, such as how people perceive color schemes or topographic exaggeration.
In addition to initial user input, these advancements also take into account user feedback at each step as the models are refined. This process is a continuous loop as storms and flooding shape the coast causing additional vulnerabilities to future flooding, users provide feedback, and the team refines the model and outputs (Figure 1). These types of outputs also allow for evaluating how the duration of inundation can impact recovery activities.
Figure 1. This is a depiction of how the barrier island would change in front of Trustom Pond (South Kingstown, RI) if hurricane Sandy hit with an increase in 1 foot of sea level. With this scenario cut throughs occur where the ocean breaches the dunes and washover fans form. While this is part of a natural process, it can have major impacts if there are structures on the barrier island or activities like aquaculture in the pond that can be affected by changing salinity.
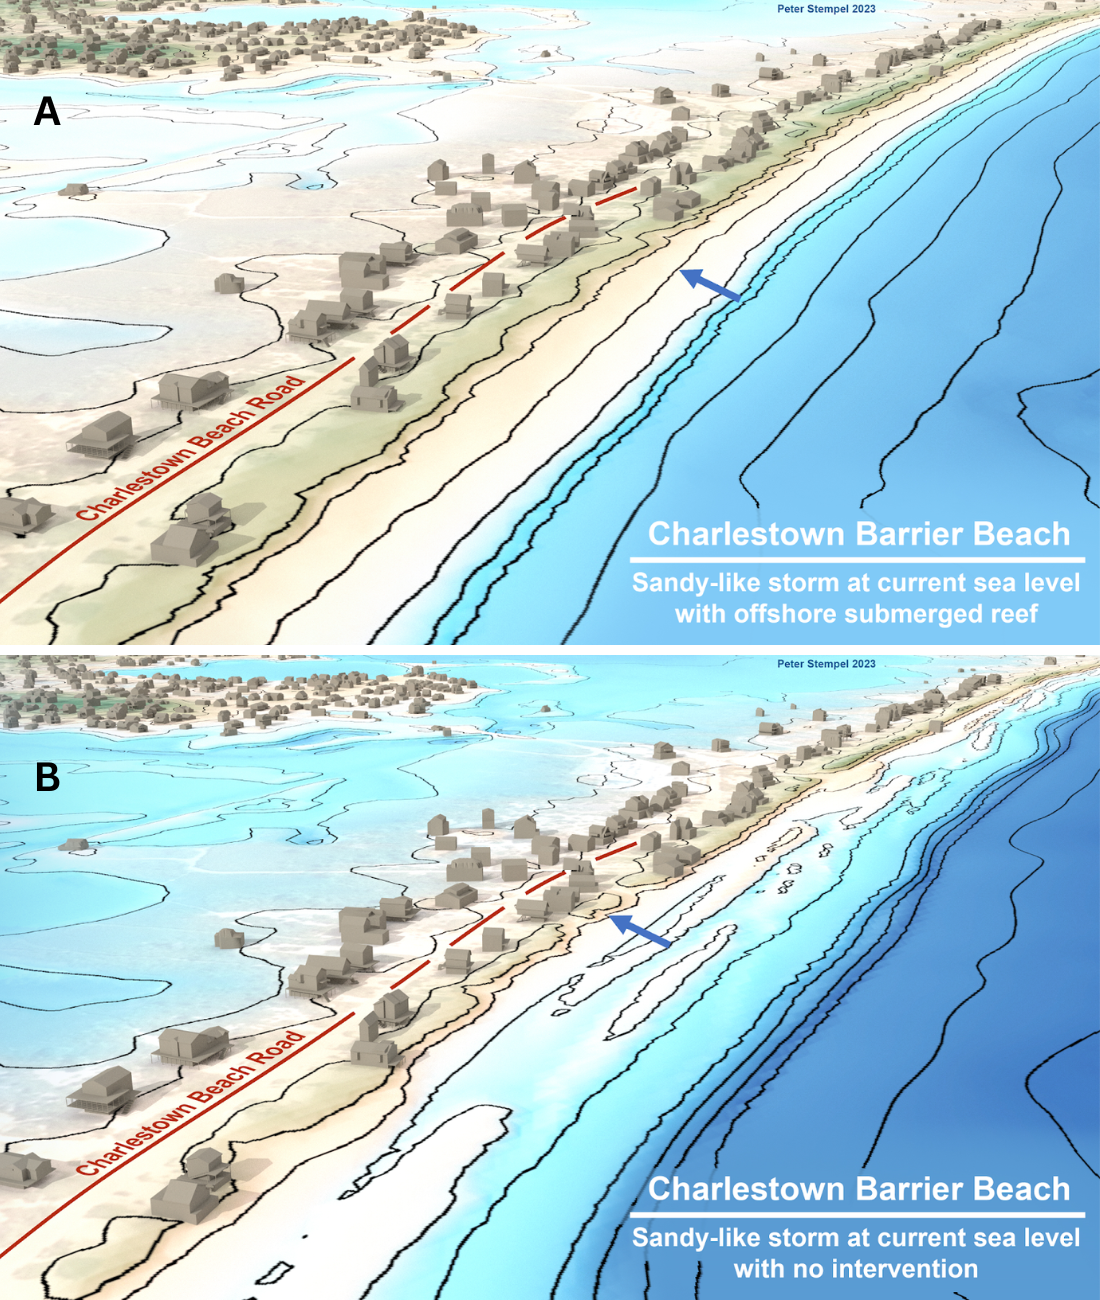
Predictions of vulnerability become more valuable if the models are run under scenarios of future planning or projects and can help inform effective actions (Figure 2). In addition, this type of modeling and combined visual and quantitative outputs provides a community with a more realistic understanding of their current and future risk and consider the performance of a range of engineered and more natural flood mitigation efforts. These approaches are also informative for considering actions that a community would desire to be effective over longer time scales like determining the best timing for realigning infrastructure, updating building codes, or acquiring land.
Visit the team’s article to learn more about their approach. The project associated with this work is led by Dr. Isaac Ginis of the University of Rhode Island (URI) with URI co-partners J.P. Walsh, Stephan Grilli, Pamela Rubinoff, Annette Grilli; Peter Stempel of Penn State University; collaborators with US Fish & Wildlife Service, the National Park Service, and Schoodic Institute at Acadia National Park, including Hannah Webber and Catherine Schmitt. The project is part of NCCOS’s Effects of Sea Level Rise Program (ESLR) Program.
Citations:
- Stempel, P., Nasr-Azadani, E., Grilli, A., Grilli, S., Shuh, E., Groetsch, F., Ginis, I., Crowley, D., Walsh, J.P., Whaling, I., Damon, C., Duhaime, R., Rubinoff, P., and Schmitt, C. 2023. 3D Morphodynamic Visualizations of Storm Impacts for Decision Support. Journal of Digital Landscape Architecture, 8 (10). DOI: 10.14627/537740058.
- Stempel, P., Nasr-Azadani E., Russ, C., Crowley, D., Walsh, J., Harrington, J., Damon, C., Duhaime, R., Rubinoff, P. 2024. Interpreting Dynamic Landscapes: Animated Landscape Visualizations to Improve Communication of Changing Coastal Conditions.Journal of Digital Landscape Architecture, 9-2024, pp. 182-192. © Wichmann Verlag, VDE VERLAG GMBH · Berlin · Offenbach. DOI: 10.14627/537752018