Lake Erie Harmful Algal Bloom Forecast
NOAA provides forecasts for seasonal blooms of cyanobacteria (blue-green algae) in Lake Erie, typically from July to October when warmer water creates favorable bloom conditions. Western Lake Erie has been plagued by an increase of HABs intensity over the past decade. These blooms consist of cyanobacteria or blue-green algae, which are capable of producing toxins that pose a risk to human and animal health, foul coastlines, and impact communities and businesses that depend on the lake. A combination of satellite image (for bloom location and extent), a forecasting and mixing model provide information on the current status of the bloom, forecasted position both at the surface and at depth, and toxicity from field samples. See individual products and our FAQs for more information. For our Lake Erie Hypoxia forecast click here.
Forecast Products
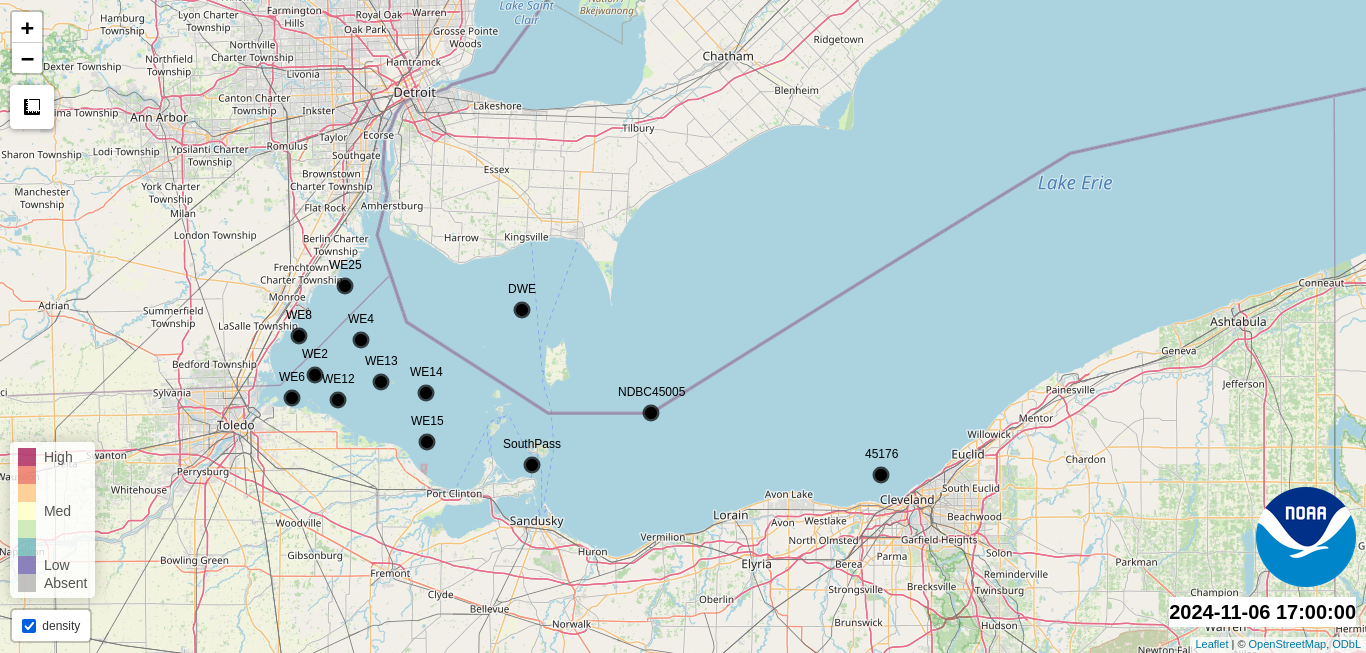
Cyanobacteria is not currently detectable by satellite in western Lake Erie. We will update the Observed and Forecasted Bloom Position when cyanobacteria is detectable. The seasonal forecast for the cyanobacteria bloom in Lake Erie was issued June 29, and can be found by clicking here. No recent toxin data currently available. --Hounshell, Yu 06/30/2025
The past few days of imagery can be seen at the HAB monitoring site. The Lake Erie Forecast is operated by the National Centers for Coastal Ocean Science. Contact hab@noaa.gov for technical Questions. Last Updated: 2025-06-30 06 PM EST
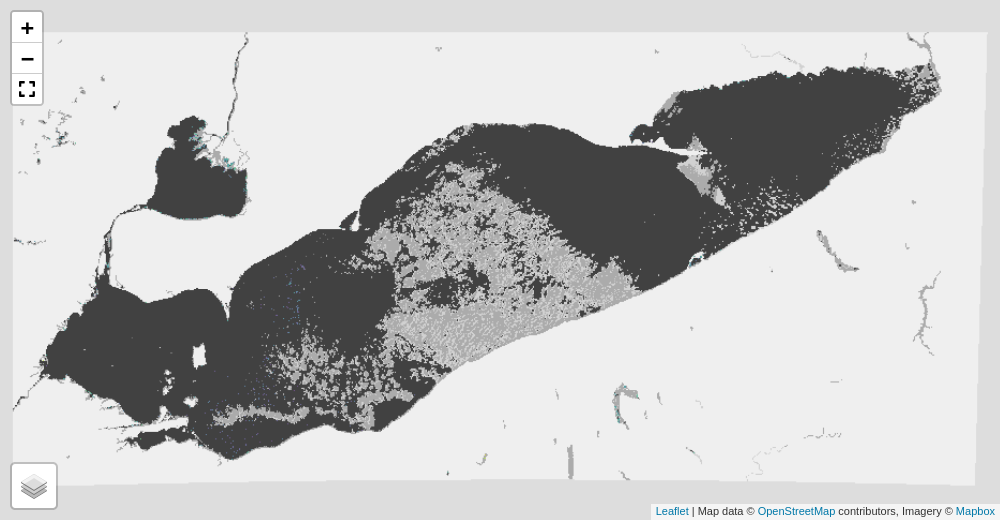
Observed Bloom Position
(from most recent satellite image)
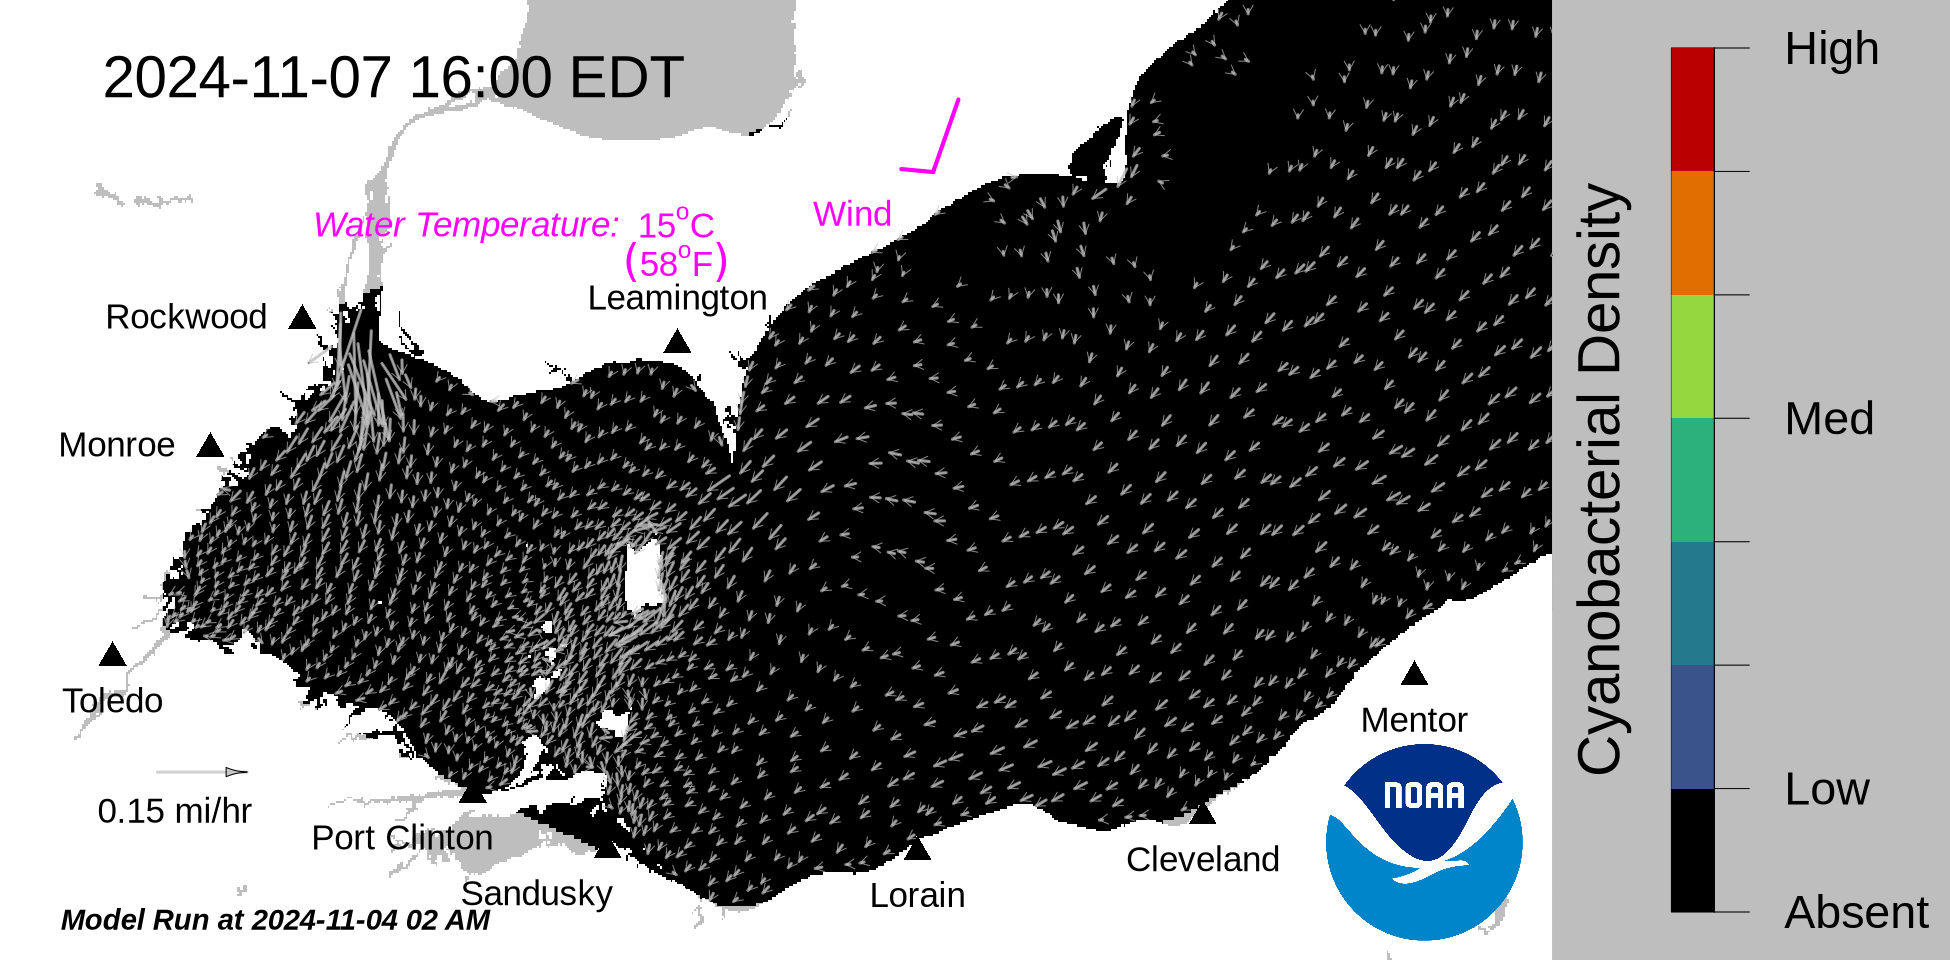
Forecasted Bloom Position
(from modeling)
Vertical Mixing Forecast
HAB Alerts
HABs in Lake Erie pose a risk to human and animal health, foul coastlines, and negatively impact communities and businesses. Sign up to receive Lake Erie HAB updates via email.
2025 Western Lake Erie Projections
The early season projection estimates bloom severity based on Maumee River discharge and modeled phosphorus loads. It is issued weekly from May until the seasonal forecast is announced.
2025 Lake Erie Seasonal Forecast Event
The official seasonal forecast for Lake Erie will be announced on June 26, 2025 during a live webinar hosted in collaboration with Ohio Sea Grant. Registration details can be found here.
Additional Resources
- Archived Lake Erie Forecasts
- More information about our bloom monitoring imagery
- FAQs – Frequently Asked Questions about cyanobacteria and the forecasts NOAA issues
- Contributors and Data Providers
- Lake Erie HAB Forecast Guide – User guide to help navigate the forecast products
For other data on Lake Erie HABs, visit one of these websites:
- NOAA GLERL – HAB Program
- NOAA GLERL – Great Lakes Coastal Forecasting System
- NOAA National Weather Service, Cleveland
- Ohio EPA
- Ohio State University
- Heidelberg University, National Center for Water Quality Research
For safety information on these blooms, visit the Ohio EPA website.