The Coastal Pollution Data Explorer is an interactive web-based platform that enables users to explore spatial and temporal trends in chemical contaminant data across U.S. coastal areas. Users can compare, analyze, graph, map, and download contaminant data collected by National Centers for Coastal Ocean Science (NCCOS) from 1986 to the present.
Why It Matters
The Coastal Pollution Data Explorer (CPDE) provides a one-stop resource for accessing, downloading, and visualizing NCCOS’s chemical contaminant data, including:
- National Mussel Watch Program data (the nation’s longest-running contaminant monitoring program)
- Additional data collected by NOAA’s National Centers for Coastal Ocean Science
By making nearly 40 years of contaminant data easily accessible through an interactive interface, the CPDE helps scientists, managers, policymakers, and the public better understand how coastal chemical stressors affect ecosystems and communities. This knowledge supports informed resource management decisions.
What You Can Do
- Explore and visualize data
- Map and graph contaminant trends across sites, regions, and species
- View analyte-level results, grouped contaminants, or nationwide summaries
- Filter data by location, contaminant, species, or time period (1986–present)
- Download data
- Export custom subsets or download the full dataset (over 1.4 million records)
- Generate custom Infographic Reports
- Summarize contamination in an area of interest
- Compare results to regional and national averages
- View contaminants/metals sampled in a location of choice
Common Questions the CPDE Helps Answer
- What are regional concentration trends of contaminants from 1990 to the present, and how does this vary between sediment and tissue samples?
- How has the concentration of pollutants changed within a major waterbody (i.e., Chesapeake Bay) since 1986?
- Where is PFAS concentration the highest in the nation?
- What has the sampling frequency near a site been for the last 20 years?
How CPDE works
The CPDE provides three main pathways to interact with the data:
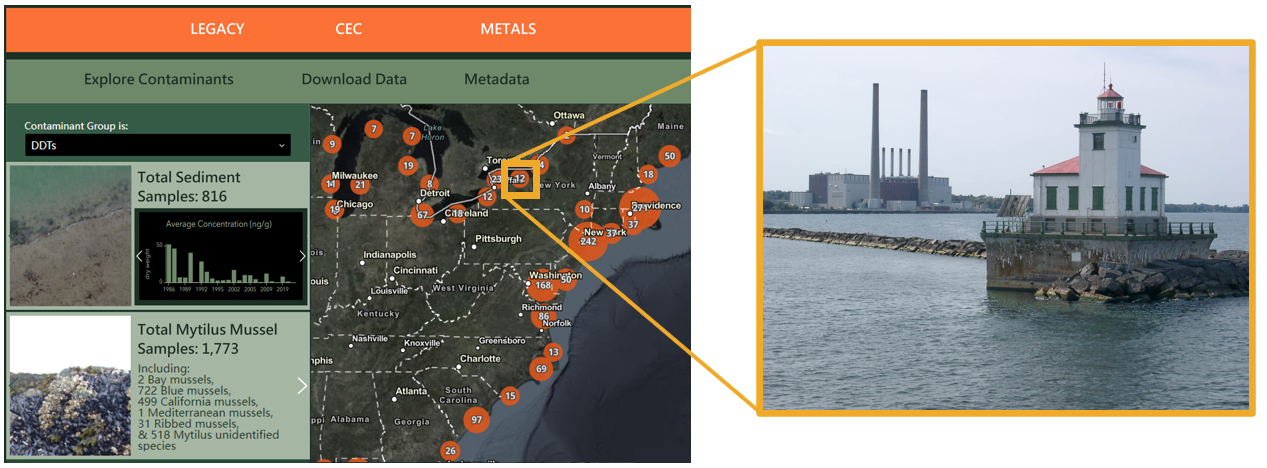
- Explore Data by Contaminant Group – Select a contaminant or metal to see maps and charts of its spatial and temporal trends.
- Export Data – Download a tailored dataset for your research needs, or access the entire dataset of more than 1 million records.
- Infographic Reports – Build customized reports summarizing contamination in a chosen area, with comparisons to regional and national levels.
Next Steps
- Future sampling data from Mussel Watch and other Special Studies will be added annually.
- Widgets and tools will be updated approximately three times a year.
- Ongoing User feedback will guide improvements in accessibility, usability, and performance.
Stay Updated
- Please join our CPDE email list to receive periodic announcements about new features and data updates. Your contact information will remain private, and you may update your subscription preferences at any time.