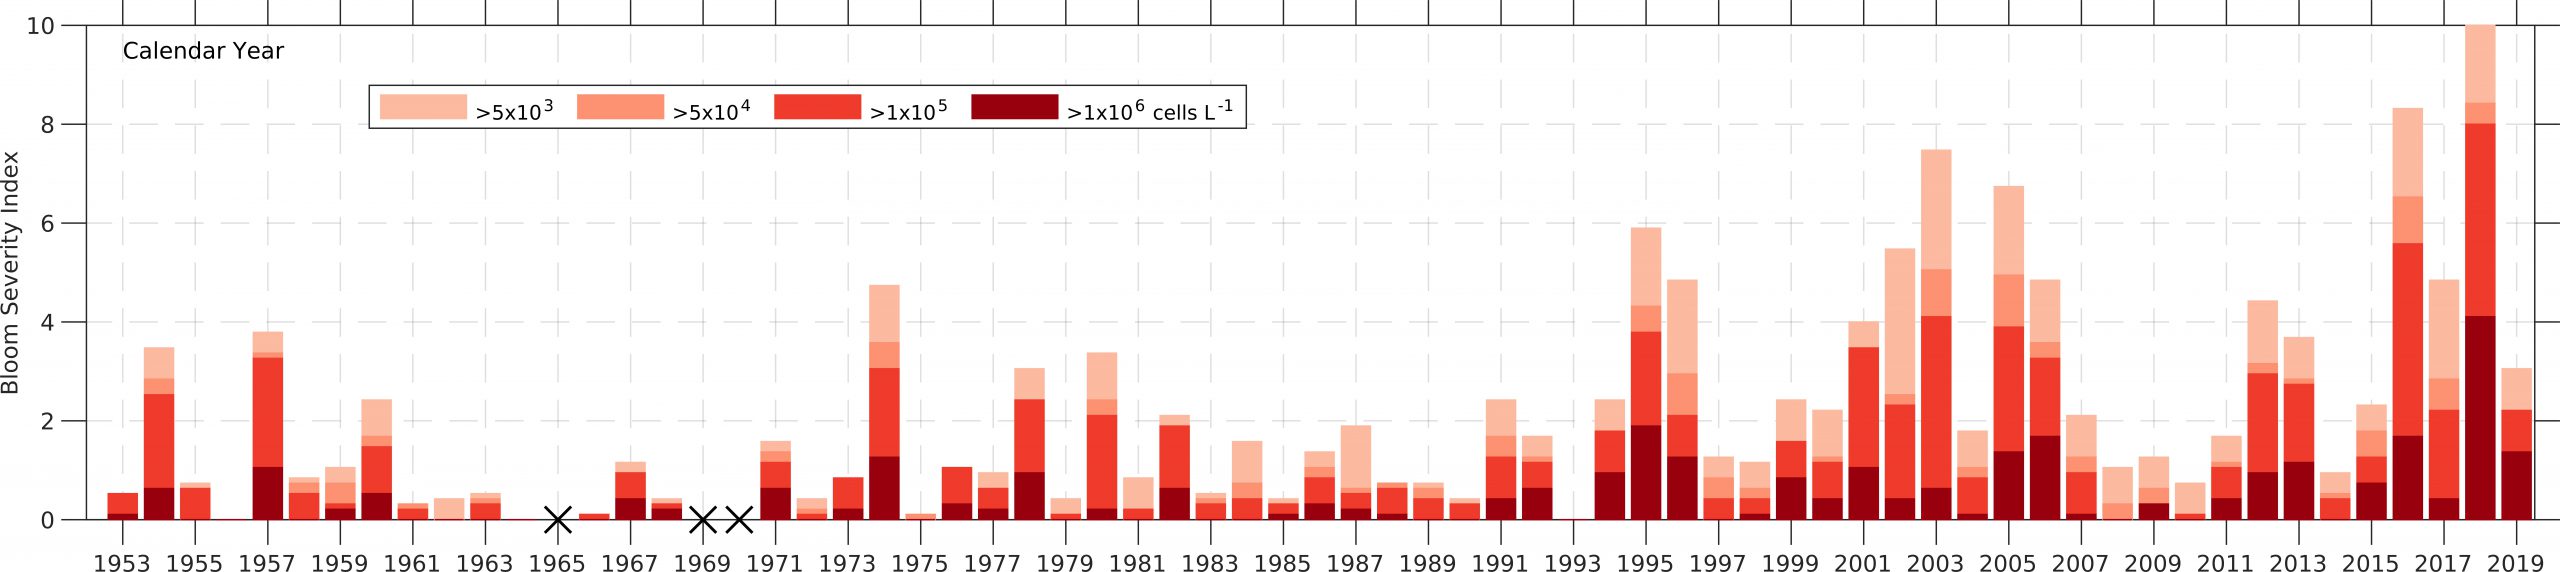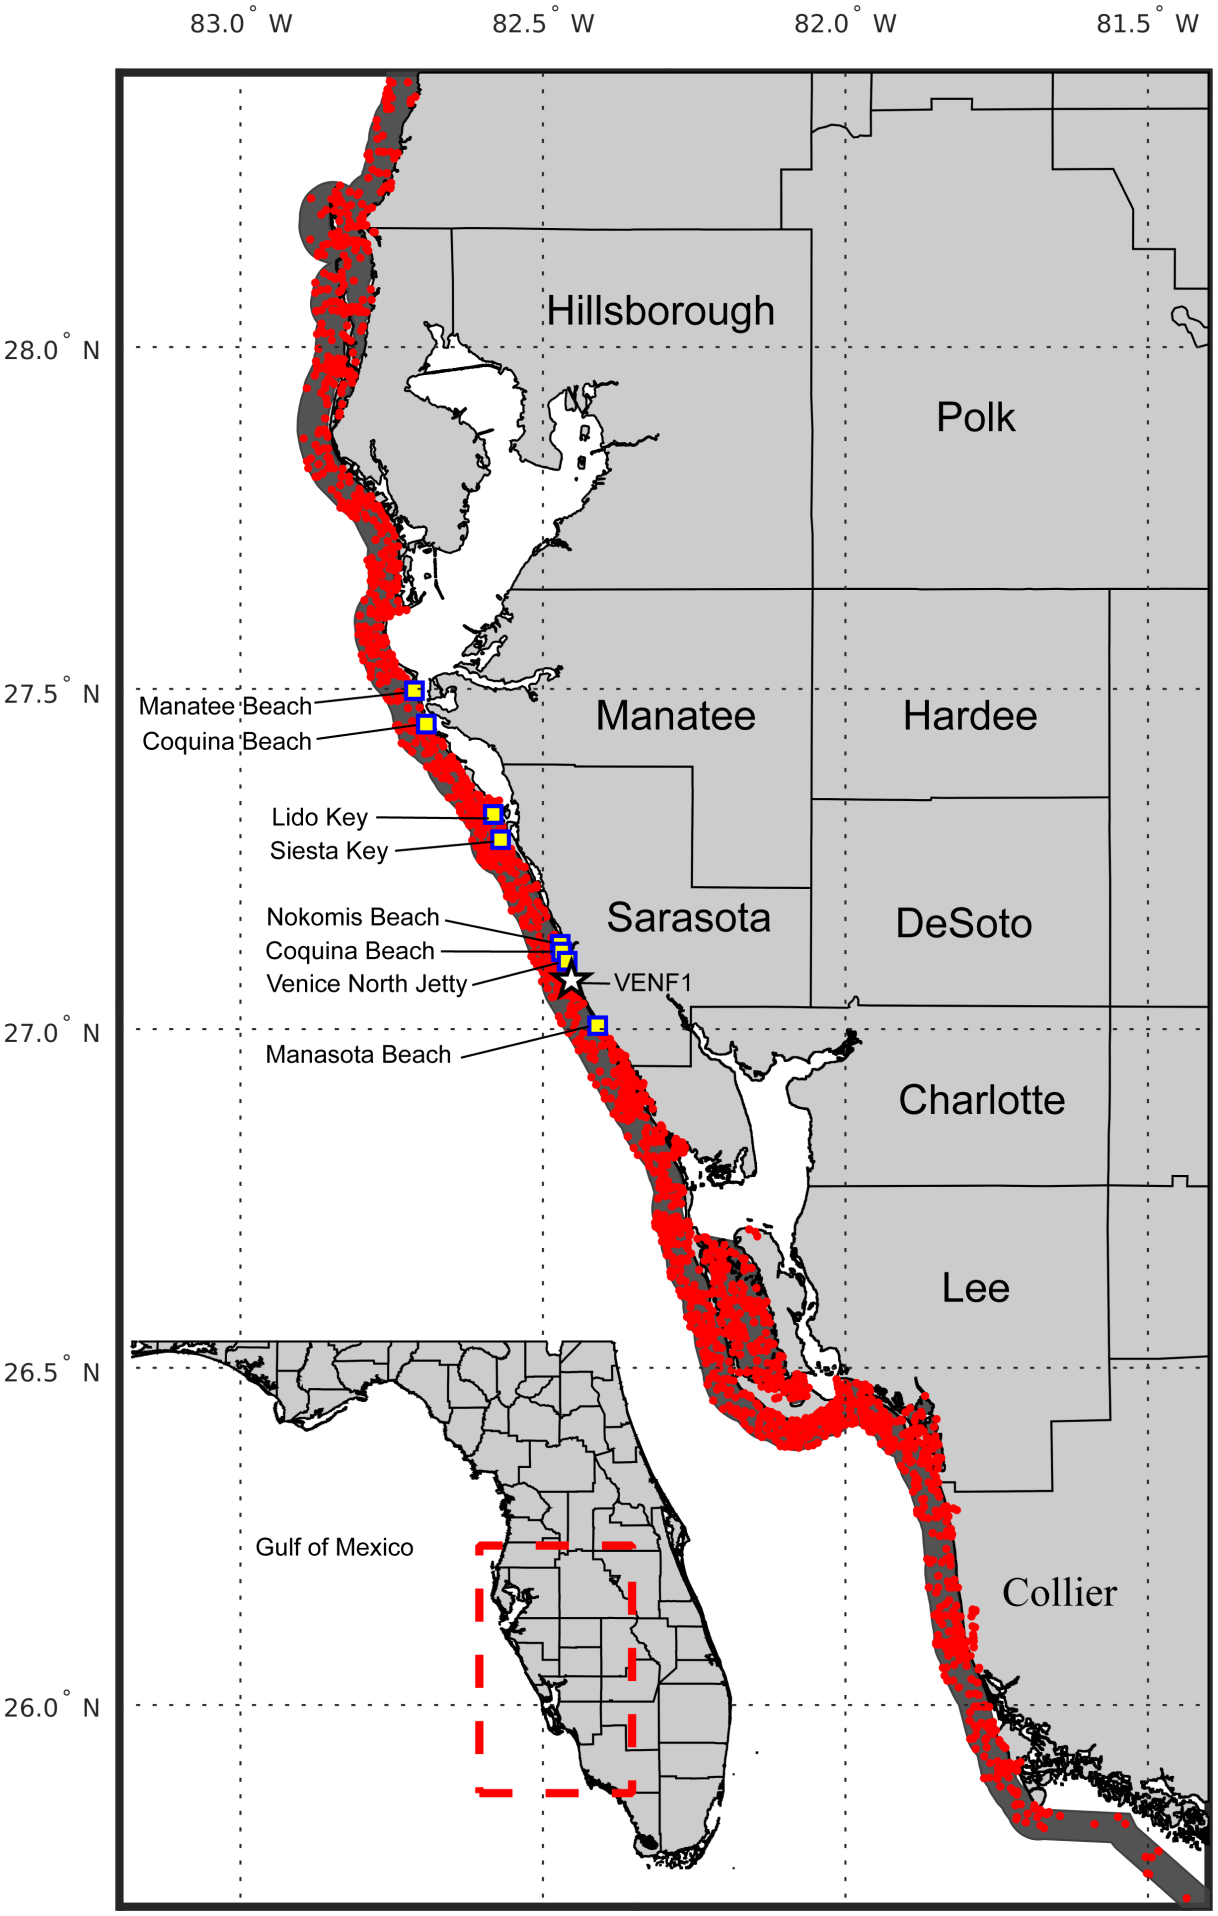
Nearly all annual blooms of the red tide-forming, toxic dinoflagellate Karenia brevis (K. brevis) pose a serious threat to coastal Southwest Florida. New research developed methods to analyze over 60 years of data of K. brevis cell counts, or concentrations, along the coast of SW Florida to define bloom severity, annual and interannual bloom cycles, and associated respiratory irritation.
The development of a bloom severity index and a respiratory irritation index allow for the comparison of bloom severity from year-to-year. The study findings confirm that blooms typically form in August and continue through the winter, with October and November being the months most frequently impacted. However, higher-than-usual offshore winds can suppress the respiratory impact of blooms. Years with severe blooms, such as 2006, 2012 and 2018, caused noticeable respiratory irritation, while other years with blooms had almost no respiratory impacts (2008, 2009, 2011, 2013, 2014). Calendar year 2018 had the most extensive red tide on the SW Florida coast. The respiratory irritation index measured in 2018 in Manatee and Sarasota Counties was the highest on record, and routine monitoring started in 2006.
Red tide blooms can discolor water, kill fish and marine mammals, contaminate shellfish, cause mild to severe respiratory irritation, and discourage tourism and recreational activities, leading to significant health and economic impacts in affected communities. These findings can be used to help managers and decision makers both evaluate the risks along the coast during events and design systems to better respond to and mitigate bloom impacts. The analysis also identifies a wind metric that can be used to associate bloom concentration to respiratory irritation, which may help future socioeconomic studies.
The study was conducted by researchers with NOAA’s National Centers for Coastal Ocean Science (NCCOS), the Gulf of Mexico Coastal Ocean Observing System (GCOOS) Regional Association, and the Florida Wildlife Conservation Fish and Wildlife Research Institute (FWC-FWRI). Observed cell counts near SW Florida were derived from FWC-FWRI HAB Monitoring Database. Beach Conditions Reporting System data since 2015 was provided by Mote Marine Laboratory.