 An official website of the United States government.
  Official websites use .gov
A .gov website belongs to an official government organization in the United States.
Official websites use .gov
A .gov website belongs to an official government organization in the United States. Secure .gov websites use HTTPS
A lock or https:// means you’ve safely connected to the .gov website. Share sensitive information only on official, secure websites.
Secure .gov websites use HTTPS
A lock or https:// means you’ve safely connected to the .gov website. Share sensitive information only on official, secure websites.NCCOS-sponsored researchers at the University of Central Florida (UCF) are developing an improved web-based interactive sea level rise viewer. Interactive sea level rise viewers (ISLRVs)aremap-based visualization toolsthatcommunicate the impacts of climate change-related sea level rise (SLR),associated with increased flooding, coastal erosion, storm surge damage, and saltwater intrusion.
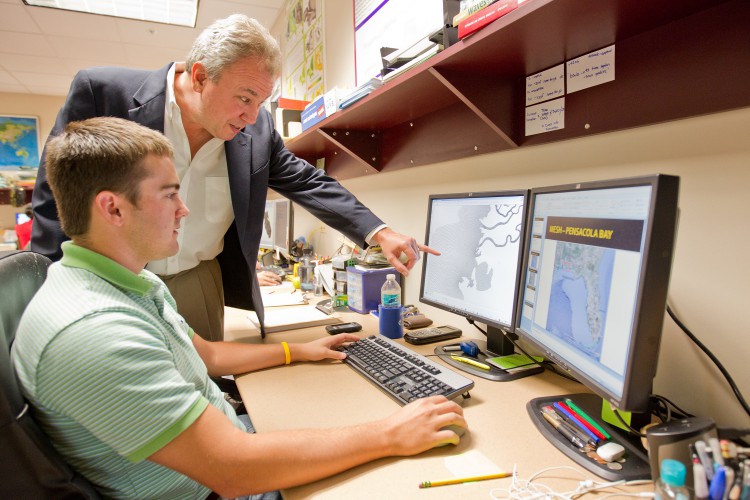
Dr. Scott Hagen (standing) directs the University of Central Florida Coastal Hydroscience Analysis, Modeling & Predictive Simulations (CHAMPS) Laboratory and is the lead investigator on the NCCOS sponsored project modeling SLR impacts in the Mississippi-Alabama-Florida panhandle region. Credit: University of Central Florida.
Traditional story telling uses the printed word to teach and connect readers with ideas and new thoughts, where visualization is primarily user's imagination. ISLRVs are a common and technical way to enhance a viewer's visualization of climate change beyond the imagination, and they vary by narration(or storytelling)features. These web-based computer visualizations use virtual tools, such as interactive maps and data sets, allowing users to explore and construct alternative interpretations of information.
Ananalysis of six story telling features for twenty different ISLRVs guidedUCF researchers to develop a new ISLRV with improvements in user communication effectiveness, in conjunction with the modelling of SLR impacts in the Mississippi-Alabama-Florida Gulf of Mexico region. The key story telling features analyzed includedtechnical/conceptual support, uncertainty/risk, realism, interaction structure, local impacts and/or global perspective, and features for users to complete a task successfully (self-efficacy). In general, themore complex models andscenario selection tools an ISLRV has, the better the user'sconceptual visualization.
The results suggestthat careful design of narrative-building features may increase communication effectiveness of these visualization tools by enhancing user engagement and promoting insight. Adetailed study is published in the online scientific journal Science Communication .
For more information, contact David.Kidwell@noaa.gov.