HARMFUL ALGAL BLOOM FORECASTS
Southwest Florida Satellite Imagery
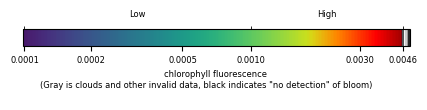
Composite 8-days of satellite imagery up to 07-04-2025 showing location of algae bloom which may include algae besides K. brevis. Overlaid cell count data provided by several contributors. The past few days of imagery can be seen at the HAB monitoring site.
Water samples from 06-27-2025 to 07-04-2025 found Karenia brevis was either not present or at background levels so there is no risk of respiratory irritation and blooms in imagery are unlikely to be a red tide (caused by Karenia brevis).
Water samples from 06-27-2025 to 07-04-2025 found Karenia brevis was either not present or at background levels so there is no risk of respiratory irritation and blooms in imagery are unlikely to be a red tide (caused by Karenia brevis).
The images were derived from Copernicus Sentinel-3 satellite data from the European Organisation for the Exploitation of Meteorological Satellites (EUMETSAT) and were processed by NOAA, National Centers for Coastal Ocean Science. Cell count data were provided by several contributors.
See more information about our bloom monitoring imagery.