HARMFUL ALGAL BLOOM FORECASTS
Southwest Florida Intensification Forecast
The Southwest Florida Intensification Forecast provides an early warning of red tide initiation or intensification for coastal managers and decision makers. Red tide, also known as the dinoflagellate Karenia brevis, is harmful to marine animals and can cause respiratory distress in humans. Due to this health concern, beach closures may be necessary when coastal waters contain high concentrations of Karenia brevis. The Southwest Florida Intensification Forecast alerts coastal managers to potential red tide (Karenia brevis) bloom initiation or intensification along the southwest Florida coast, which provides advanced warning of a potential bloom and helps to minimize impacts to public health and coastal economies.
This model uses a nowcast/forecast system to predict potential harmful algal blooms initiation along the coast of Southwest Florida.
No additional bloom initiation/intensification is expected from onshore transport of Karenia. The bloom intensification forecast will be discontinued until conditions for onshore transport resume, typically in early fall. Last Updated: 2025-01-02 EST
How the Forecast Works
During the early bloom period (typically each fall), Karenia brevis cells—which persist in the bottom waters offshore—can be moved onshore to the Southwest Florida coast by a process known as coastal upwelling. The graphics below demonstrate this process. Once near the coast, Karenia brevis cells can quickly reach levels that create a harmful algal bloom (HAB).
Image Caption: Downwelling – Southerly winds blowing along the Florida coast leads to downwelling. Offshore surface waters are moved onshore. Onshore bottom waters are moved offshore. Subsurface Karenia brevis cells are moved offshore resulting in low risk of bloom initiation.
Upwelling – Northerly winds blowing along the Florida coast leads to upwelling. Onshore surface waters are moved onshore. Subsurface Karenia brevis cells are moved onshore resulting in a high risk of bloom initiation.
Risk of HAB Initiation or Intensification
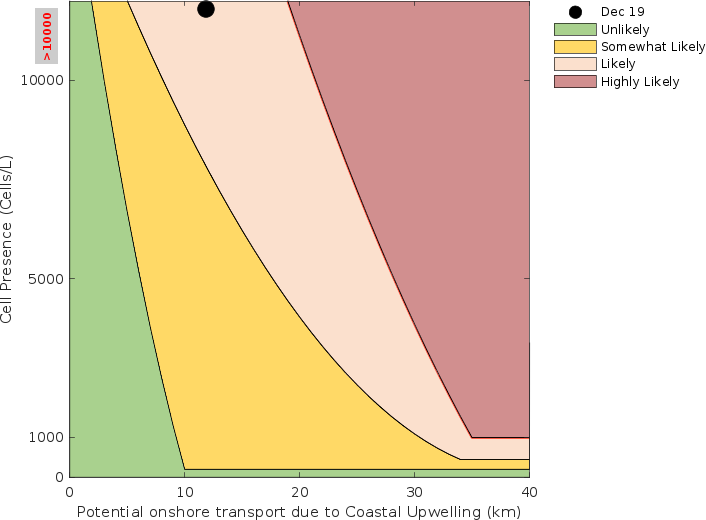
The likelihood of HAB initiation or intensification is greatest when Karenia brevis (red tide) cells are present (> 0 cells per mL) and there is a large onshore particle transport in the bottom waters (distance moved toward the coast or beach > 10 km). The greater the onshore transport in the bottom waters, the more likely HAB initiation or intensification will occur. K. brevis cell presence is estimated as the total of the top three observed
cell counts for the past 10-days.
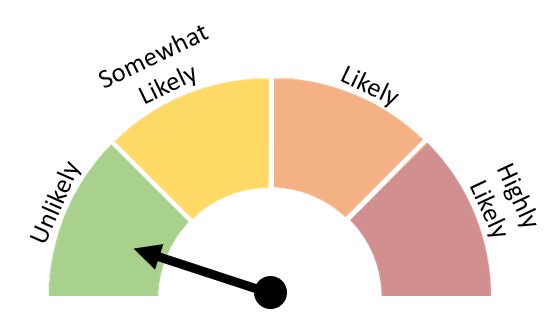
Highly Likely – there is a high potential for HAB initiation or intensification to occur in the next 10 days due to large onshore movement at the bottom waters and elevated observed cell counts.
Likely – there is a likely potential of HAB initiation or intensification to occur due to the extent of onshore movement at the bottom and elevated observed cell counts.
Somewhat Likely – there is the potential for HAB initiation or intensification to occur due to onshore movement at the bottom and/or elevated observed cell counts.
Unlikely – HAB initiation or intensification is unlikely to occur due to low risk of onshore movement at depth and/or low observed cell counts.
Likelihood of HAB intensification along the southwest Florida coast for the two most recent forecast dates. Risk of HAB intensification is dependent on the potential for onshore particle movement in the bottom waters due to coastal upwelling (X-axis) as well as observed Karenia brevis cell concentrations (Y-axis). Unlikely (shaded grey area) indicates HAB intensification is unlikely to occur due to low risk of onshore movement in the bottom waters and/or low observed cell counts; Somewhat Likely (shaded blue area) indicates there is the potential for HAB intensification to occur due to onshore particle movement in the bottom waters and/or elevated observed cell counts; Likely (shaded purple area) indicates there is a likely potential of HAB intensification to occur due to the extent of onshore particle movement in the bottom waters and elevated observed cell counts; Highly Likely (shaded red area) indicates there is a high potential for HAB intensification to occur in the next 10 days due to high potential for onshore particle movement in the bottom waters and elevated observed cell counts.
Particle (Karenia brevis cell) Movement
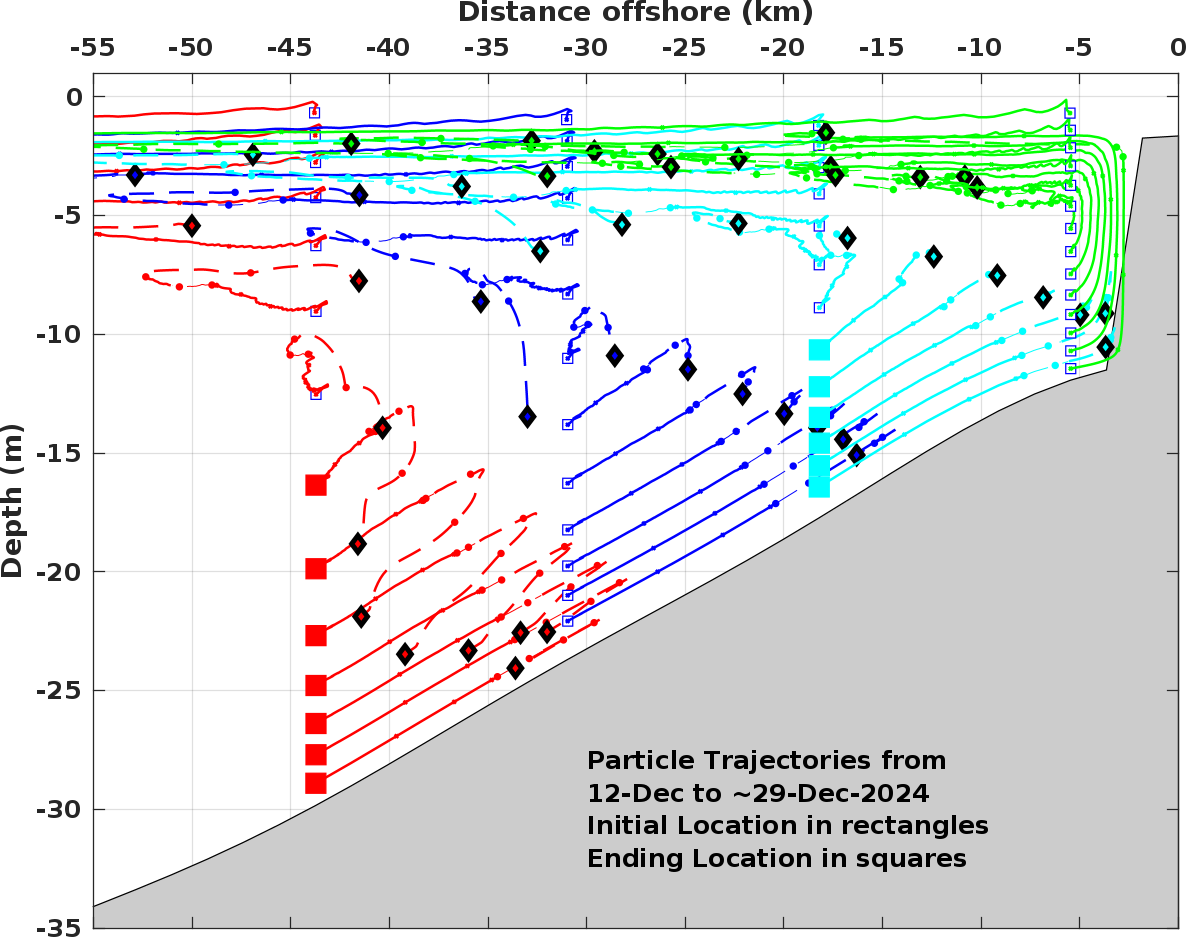
The animation below shows the onshore and offshore movement of particles (representing Karenia brevis cells) along the southwest Florida coast from 7-days prior to the forecast date to 10-days after the forecast date. Particles start at 44 km (red), 31 km (dark blue), 18 km (light blue), and 6 km (green) offshore 7-days prior to the forecast date. The forecast uses a hydrodynamic model, which simulates water movement off the southwest Florida coast, using forecasts of wind speed and direction.
An animation showing the cross-shore (onshore/offshore) movement of particles over the course of the model simulation along the southwest Florida shelf. Fifteen simulated particles, representing Karenia brevis cells, are released at each location along the cross-shore at 44 km (red), 31 km (dark blue), 18 km (light blue), and 6 km (green) offshore. The initial location of particles are shown as rectangles (7-days prior to the forecast date) with final particle locations represented as diamonds (10-days into the future from the forecast date). Solid lines represent the hindcast particle movement (starting 7-days prior to the forecast date), and dashed lines show the forecasted particle movement (10-days into the future from the forecast date). The X-axis is the offshore distance and the Y-axis is water depth. The cross-shore transport model uses a 3D hydrodynamic model with forecasted wind speed and direction to predict cross-shore particle movement.
Particle (Karenia brevis cell) Transport
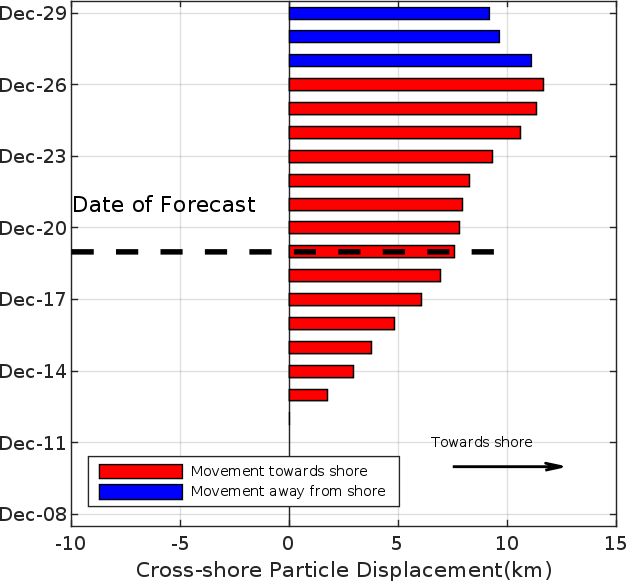
Cross-shore (toward or away from the coast) particle movement along the southwest Florida shelf is dependent on particle movement toward shore (red) and particle movement offshore (blue) at the bottom, where simulated particles mimic Karenia brevis (red tide) cells. A high potential for bloom intensification exists when there is onshore particle movement (representing Karenia brevis cells) in the bottom waters (red) and large on-shore particle transport (> 10 km). There is a low potential for bloom intensification when there is offshore particle movement in the bottom waters (blue).
The dashed line (Date of Forecast) designates the forecast date. Cross-shore particle (Karenia brevis) movement prior to the Date of Forecast (below the dashed line) is considered a hindcast while above the dashed line represents the forecast. Onshore transport in the bottom waters is averaged from both offshore sites (18 km offshore, > 15 m depth), and onshore sites (3 km offshore, > 10 m depth).
Model wind
Vector diagram of surface wind forcing used to drive cross-shore (onshore/offshore)
particle (Karenia brevis cell)
transport along the southwest Florida coast.
Vector diagram of surface wind forcing used to model cross-shore particle displacement along the southwest Florida coast. Wind direction (cardinal direction of where wind blows to) is represented as blue arrows, while wind speed (Y-axis; 18 hour low-pass filtered, in knots) is shown as the solid grey line. The wind vector diagram starts 2 weeks before the forecast date and uses forecasted winds up to 10 days into the future.

Particles represent Karenia brevis cells.
Total cross-shore particle movement along the southwest Florida coast as predicted by the 3D hydrodynamic model from 7-days before to 10-days after the forecast date. Fifteen simulated particles, representing Karenia brevis cells, are released at each location along the cross-shore at 44 km (red), 31 km (dark blue), 18 km (light blue), and 6 km (green) offshore. The initial location of particles are shown as rectangles (7-days prior to the forecast date) with final particle locations represented as diamonds (10-days into the future from the forecast date). Solid lines represent the hindcast particle movement (starting 7-days prior to the forecast date), and dashed lines show the forecasted particle movement (10-days into the future from the forecast date). The X-axis is the offshore distance and the Y-axis is water depth. The cross-shore transport model uses a 3D hydrodynamic model with forecasted wind speed and direction to predict cross-shore particle movement.
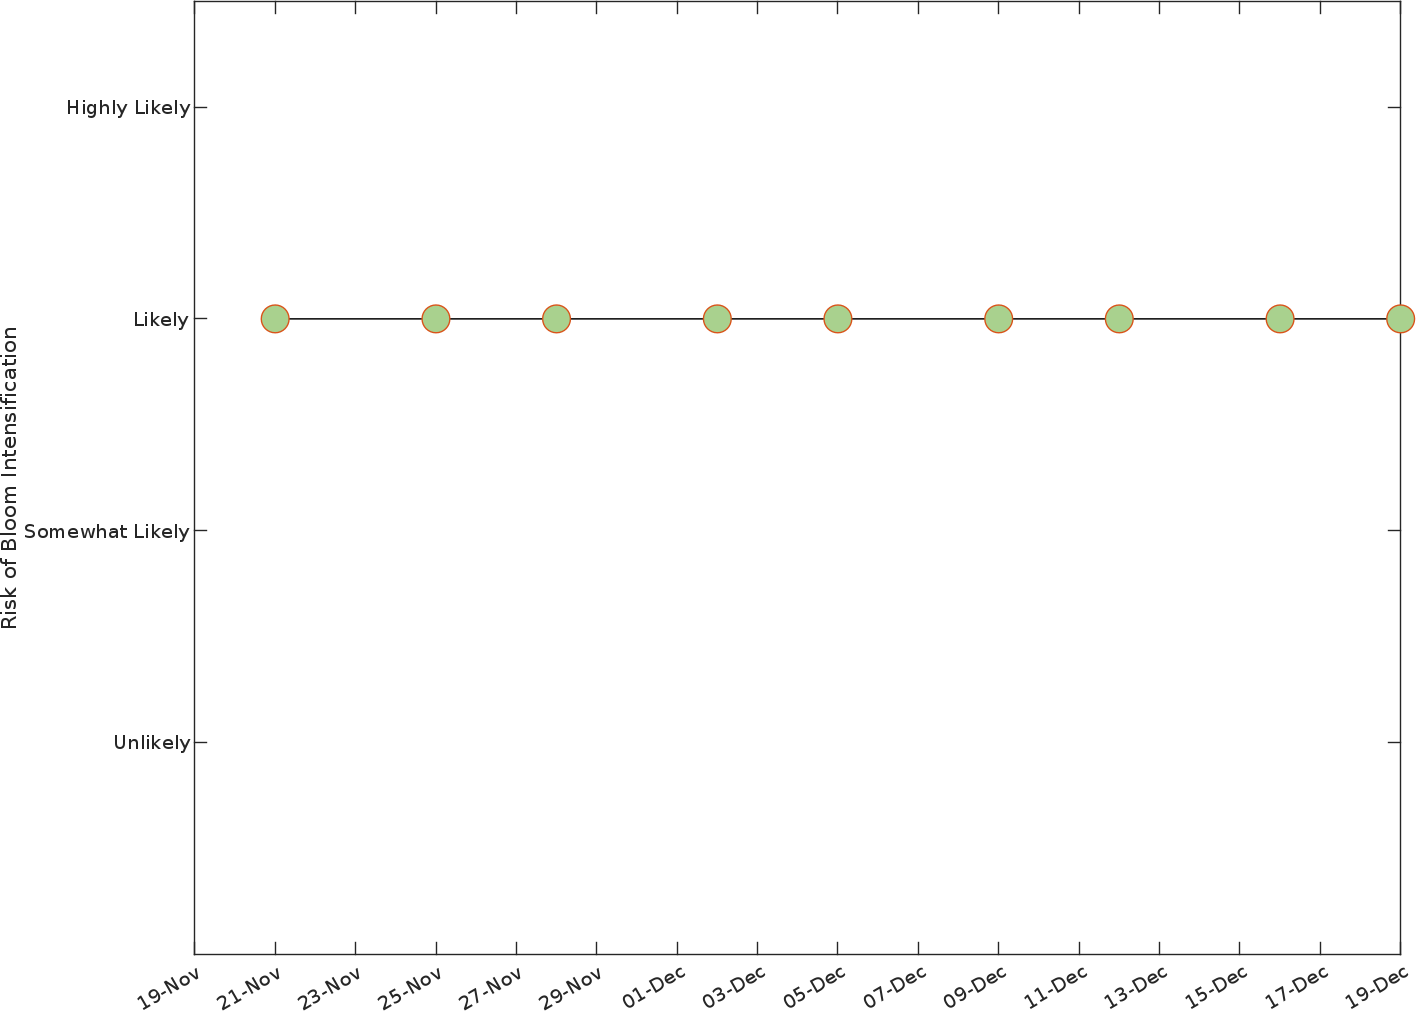
Time-series of HAB initiation or intensification risk
as predicted by modeled onshore movement at depth and observed cell counts during bloom initiation.
Time-series of bloom initiation and intensification risk as predicted by modeled onshore particle movement at depth and observed cell counts. Unlikely indicates HAB initiation or intensification is unlikely to occur due to low risk of onshore movement at depth and/or low observed cell counts; Somewhat Likely indicates there is the potential for HAB initiation or intensification to occur due to onshore movement at the bottom and/or elevated observed cell counts; Likely indicates there is a likely potential of HAB initiation or intensification to occur due to the extent of onshore movement at the bottom and elevated observed cell counts; Highly Likely indicates there is a high potential for HAB initiation or intensification to occur in the next 10 days due to high potential for onshore movement at the bottom and elevated observed cell counts.
For questions contact the NCCOS HAB Forecasting Team at hab@noaa.gov.

