Basic statistics on visitor use are lacking at Gray’s Reef National Marine Sanctuary (GRNMS). High-resolution satellite data, buoy camera pictures, and weather patterns will be used to quantify and predict visitor use on a seasonal basis at GRNMS. This is essential information for the 2020 Management Plan Review, communicating visitation patterns to constituents, and for optimally allocating limited enforcement resources.
Why We Care
Resource managers need to know how many people use an area in order to make informed decisions about managing it. Data characterizing the frequency and variety of visitor activities to Gray’s Reef National Marine Sanctuary (GRNMS) has proven difficult to obtain due to the time and costs associated with traveling to this offshore destination. Especially of concern is the unverified assumption that no visitation is occurring within the Research Area, where all activities except transiting and approved research are prohibited in order to conduct unbiased field studies. Some boat-location data have been compiled from opportunistic on-water observations, enforcement surveys, aerial platforms, surrogate data (marine debris monitoring), and even some satellite based sources, however a quantitative, statistically robust assessment has not been possible to date.
What We Are Doing
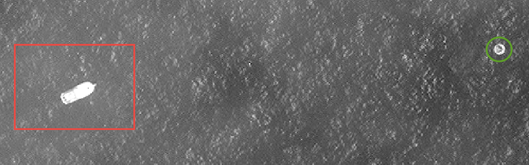
NOAA has access to high-resolution satellite imagery (WorldView2 and WV3 satellites) and has requested 6-12 months of all collections over GRNMS. The WV class of imagery has an overflight frequency of 4 days, an acquisition time of late-morning local time, and a pixel resolution of 31 cm. These attributes make it possible to identify many aspects of visitor use at GRNMS that have previously been impossible to quantify rigorously. These include variables such as boat length, type, and relative speed. We will acquire satellite images for six months (~45 scenes) beginning April 15, 2019 to October 15, 2019 with an optional additional 6 months extension pending initial results. In addition, we are acquiring all images from the buoy camera installed at GRNMS. This system collects low-resolution images every 2 hours during daylight with nearly 360° coverage and may be an additional way to measure visitation.

Working collaboratively with GRNMS and the National Marine Sanctuary Foundation, we will develop a model and produce maps predicting boat use throughout the Sanctuary by relating the boat observation data derived from satellites and buoy camera images to oceanographic variables downloaded from the GRNMS Data Buoy (wind speed, wave height, etc.). The final predictive model may include weekday/weekend, seasonal, and other parameters pending initial results.
Benefits of our Work
The results of this project will provide the sanctuary with actual visitation statistics. This information is especially timely given the anticipated Management Plan Review and associated Condition Report scheduled to begin in 2020. Apart from general visitation statistics, a key and immediate application of this information is to determine boater compliance with the Research Area (only transit and approved research activities are allowed). GRNMS and their law enforcement partners can use the data to more efficiently deploy their limited resources at times when they are most needed.
Next Steps
- Quantify location and density of visitor use at GRNMS and within the Research Area.
- Produce a statistical predictive model of vessel use seasonally based on physical
oceanographic conditions, spatial management regulations, and other factors. - Determine efficacy of the approach for continuing data collection beyond October 2019.