Two new publications describe how NCCOS scientists are developing and testing machine-learning models to predict contamination along the coast based on patterns of humans in the landscape.
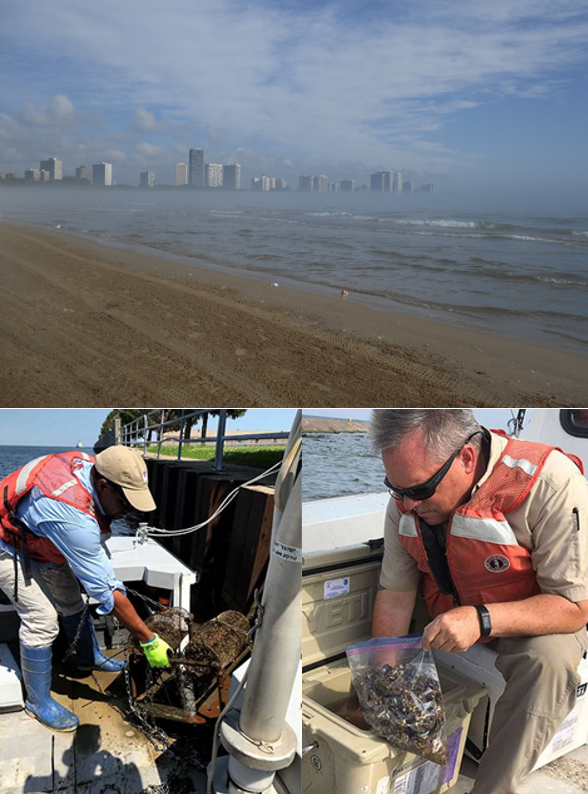
To answer critical questions about the source and fate of contaminants, NCCOS is developing new strategies to link chemical contaminants detected in bivalves (e.g., mussels and oysters) and sediments to potential sources of contamination. Through the cross-disciplinary collaborations of sociology, spatial ecology and contaminant detection, NCCOS scientists are exploring modeling and machine-learning techniques to improve the understanding of the complex interactions between the human environment and chemical contaminants.
Since 1986, the NOAA National Status and Trends Program (NST) has monitored and characterized the nation’s coastal waters for chemical contaminants and biological indicators of water quality. NST uses a multi-matrix approach that utilizes sediment, fish, bivalves, and macro infauna for contaminant monitoring (national and regional) and site characterization tasks. Contaminants monitored include legacy organic chemicals, such as organochlorine pesticides, industrial contaminants, metals, and fossil fuel combustion byproducts (e.g., polycyclic aromatic hydrocarbons [PAHs]). In recent years, these programs have added contaminants of emerging concern (CECs) to their analyses including pharmaceuticals and personal care products, alternative flame retardants, and alkylphenol and perfluorinated compounds (PFAS), nicknamed “forever chemicals”
This study utilized existing coastal contaminant data from the NOAA MWP, NST Great Lakes Restoration Initiative and Bioeffects programs and spatial human dimensions data to further characterize and predict environmental PAH concentrations and characterize the relationship between PAHs and spatial social data. Patterns in PAH data were identified using descriptive statistics and machine learning techniques that are currently being applied to CECs.
Two publications have resulted so far from this research effort: A NOAA Technical Memorandum and a peer-reviewed research paper published in the journal in Environmental Monitoring and Assessment.
In the Laurentian Great Lakes, relationships between total PAH concentration in dreissenid mussel tissue, impervious land surface percentages, and PAH relative concentration were identified and used to build a predictive model for the Great Lakes Basin (Kimbrough et al, 2021).
Along the coastal continental US, 3722 sediment samples form 263 sampling sites (derived from multiple studies over more than three decades) were combined and analyzed to gain a better perspective on PAH distribution (Freitag et al, 2021).
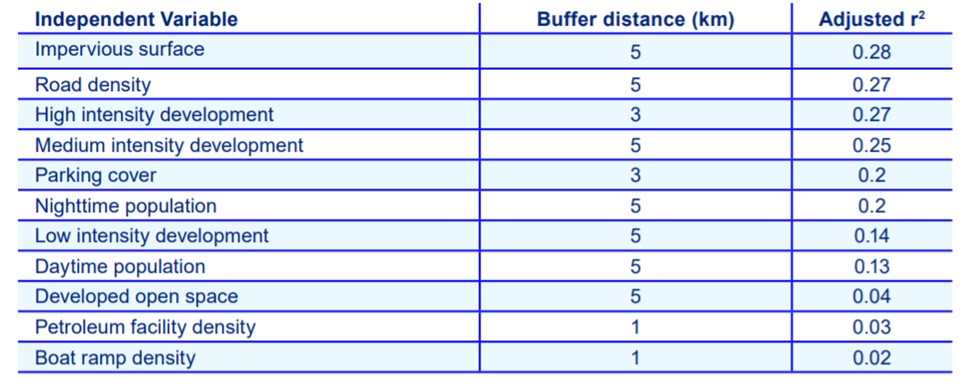
The studies determined the following list of environmental (independent) variables (factors) to test in the model: impervious surface, land use/land cover, boat ramps and marinas, population, parking lot cover, road cover, petroleum industry locations, wastewater treatment facilities, and basic demographics. The three significant variables with the highest r2 values (correlations) were road density, impervious surface, and high intensity development in a 3 km buffer (Table 1).
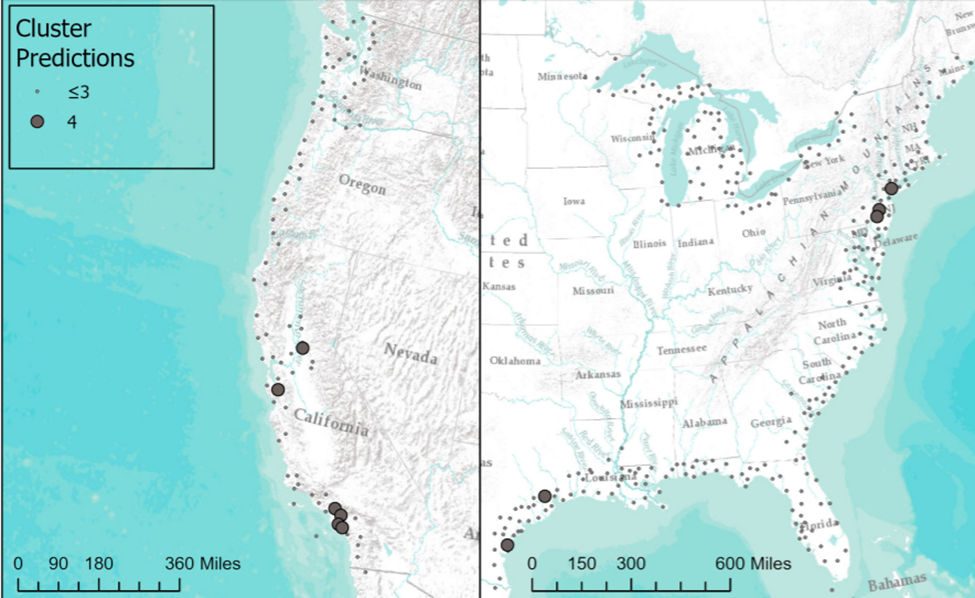
Using 5 km buffers around each sampling site and existing sampling sites for machine learning training data, the model used Random Forest predictive capabilities to predict the level of PAH concentration at the center (“centroid” of each sampling site’s watershed (based on USGS Hydrologic Unit Maps). Figure 1 depicts the centroids predicted to be in cluster 4 (high PAH levels) highlighted in large gray circles; the centroids predicted to have less PAHs (≤ cluster3) are shown in small circles.
The predicted high PAH levels are primarily (but not entirely) surrounded by urban land use and present primarily in Southern California and seaside New York, both of which have high commercial vessel port activity (Figure 1).
This project represents a first attempt to combine data from NCCOS monitoring and assessment programs for analysis using machine learning to assess data patterns and comparing them to a regression analysis. The results can help prioritize testing in areas where human activities indicate there might be reason for concern about contaminants.
Citations:
Freitag, Amy, Seann Regan, A. K. Leight, Kimani Kimbrough, Michael Edwards, Heidi Burkart, and Mary Rider. Polycyclic aromatic hydrocarbon characterization and prediction in coastal sediments using regression modeling and machine learning. Silver Spring, MD. NOAA Technical Memorandum NOS NCCOS 293, 27 pp. https://doi.org/10.25923/r7k5-vj14
Kimbrough, Kimani, Annie Jacob, Seann Regan, Erik Davenport, Michael Edwards, A. K. Leight, Amy Freitag, Mary Rider and W. Edward Johnson. 2021. Characterization of polycyclic aromatic hydrocarbons in the Great Lakes Basin using dreissenid mussels. Environmental Monitoring and Assessment 193, 833. https://doi.org/10.1007/s10661-021-09401-7