Lake Erie Forecasted Winds and Changes in Bottom Water Temperature and Dissolved Oxygen
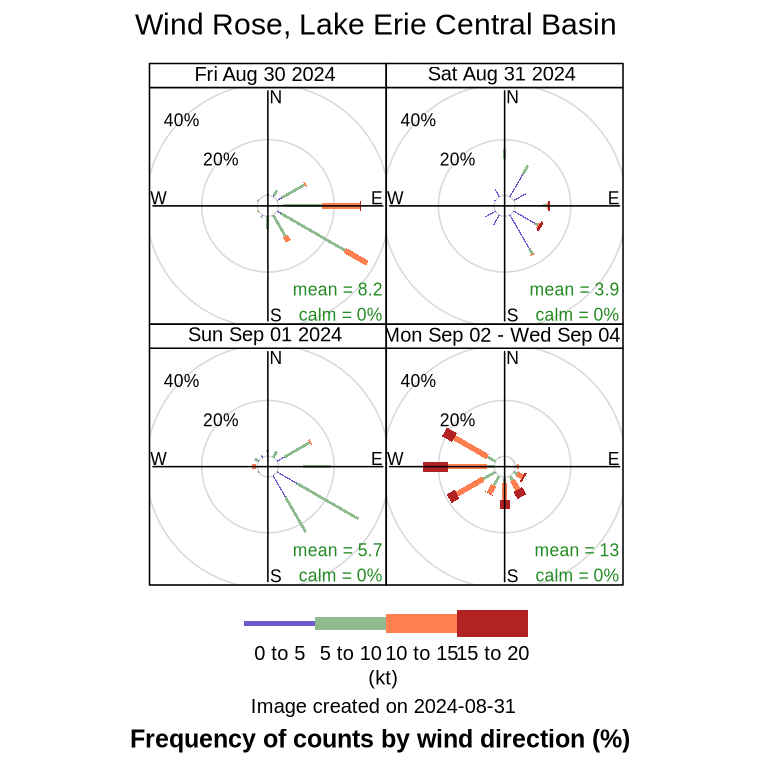
This panel depicts the frequency of occurrence of wind directions and speeds for yesterday, today, tomorrow, and the following 3 days. The length of each spoke indicates how frequently a wind blows from a particular direction. Wind speeds are indicated by color, as given by the color scale at the bottom of the plot. The data were sampled from the wind data used to drive the hydrodynamic model simulation at locations around the central basin of Lake Erie. Mean is the averaged wind speed in knots, and calm is the percent of winds with speed less than 5 kts.
These animations show the predicted changes in Bottom Temperature and Dissolved Oxygen fields from 2025-11-17 up to 6 days.
Lake Erie
SW Erie
SE Erie
Lake Erie
SW Erie
SE Erie